
Mitan Ltd
Measuring waiting time
Queues are erratic, building up suddenly with no warning, then reducing rapidly or persisting for some time. Waiting time is the most important aspect of a queue, but there is no completely satisfactory measurement of waiting time.
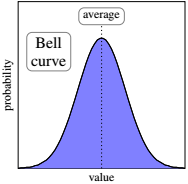
Bell curve
First chart shows the familiar bell-shape followed by many natural statistics like height and weight. The average is the most common value. Values cluster around the average, which is a good representation of what is being measured.
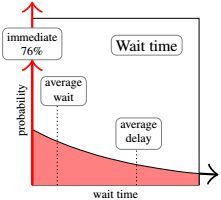
Waiting time
Waiting times in call-centres have a different pattern from the bell curve. The most common value is zero, seen by a majority of callers. Average delay (wait time for calls not answered immediately) can be several times the overall average. The average is a poor representation of wait times.
Service Level
Instead of average wait, a commonly used measurement is "service level", which is the % of customers who wait less than some target time. Call centres typically have a target like answering 80% of calls within 15 seconds.
Service-level also has limitations as a measure of waiting.
Compare call-centre and caller's views.